Native Hawaiian or Other Pacific Islanders constitute a tiny percentage: about 0.2% of degree recipients both in philosophy and overall since the category was introduced in 2011.
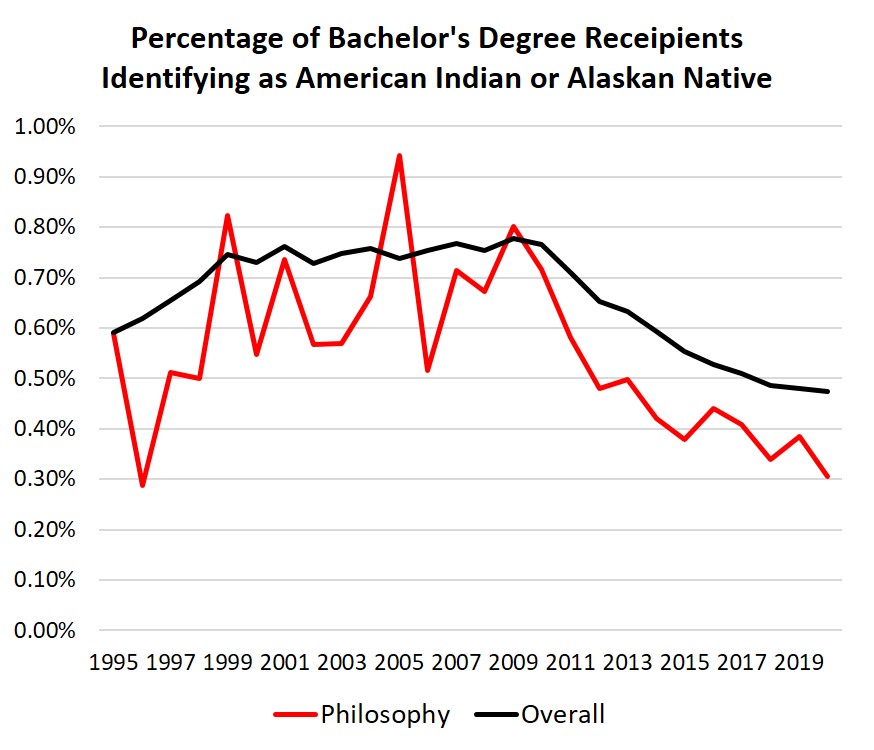
American Indian or Alaskan Native is also a tiny percentage, but unfortunately that percentage has been steadily declining since the mid-2000s, and the group is especially underrepresented in philosophy. According to the U.S. Census, about 0.9% of the U.S. population in that age group identifies as non-Hispanic American Indian or Alaskan Native.

The particular patterns differ by race/ethnic group.
The Philosophy Major Continues to Recover and Diversify in the U.S.
by Eric Schwitzgebel
[Lillian Blades – Windows of Reflection]
2010: 9274
2011: 9298
2012: 9369
2013: 9427
2014: 8823
2015: 8186
2016: 7491
2017: 7575
2018: 7669
2019: 8075
2020: 8195
In the following guest post, Eric Schwitzgebel (UC Riverside) shares some of his recent research on diversity in philosophy. A version of this post originally appeared at his blog, The Splintered Mind.
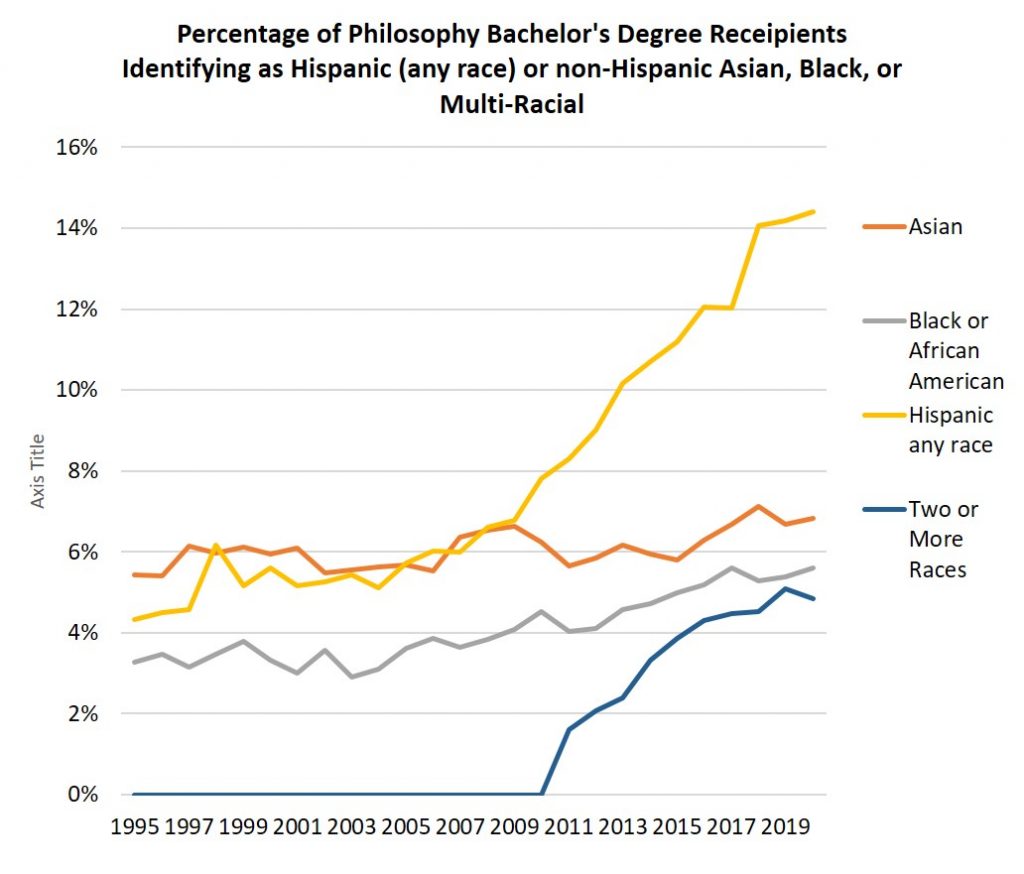
As you can see from the chart, the percentage of Hispanic students graduating with philosophy degrees has surged, from 4.3% in 1995 to 14.4% in 2020. This is approximately representative of a similar surge among Hispanic students across all majors, from 4.8% in 1995 to 15.7% in 2020. Multiracial students have also surged, though it’s unclear how much of that surge has to do with changing methodology versus the composition of the student population.
One consequence of the decline, I suspect, was on the job market for philosophy professors, which has been weak since the early 2010s. This has been hard especially on newly graduated PhD students in the field. With the major declining so sharply in the period, it’s understandable that administrators wouldn’t prioritize the hiring of new philosophy professors. If numbers continue to rise, the job market might correspondingly recover.

The percentage of philosophy majors identifying as Asian or Black has also increased during the period, but only slowly: From 5.4% and 3.3% respectively in 1995 to 6.8% and 5.6% in 2020. For comparison, across all majors, the numbers rose from 5.4% to 8.1% Asian and 7.6% to 10.2% Black. So, in 2020, Asian and especially Black students are disproportionately underrepresented in the philosophy major. Interestingly, some data from the Higher Education Research Institute suggests that there has been a very recent surge of interest in the philosophy major among Black students just entering college. We’ll see if that plays out among Bachelor’s degree recipients in a few years.


Methodology: The numbers below are all from the NCES IPEDS database, U.S. only, using CIP classification 38.01 for philosophy majors, including both first and second majors, using the NCES gender and race/ethnicity categories. Each year ends at spring term (thus “2010” refers to the 2009-2010 academic year).
Total degrees awarded across all majors has also continued to rise, and thus in percentage terms, philosophy remains well below its peak of almost 0.5% in the late 2000s and early 2010s — only 0.31% of students, a tiny percentage. Philosophy won’t be overtaking psychology or biology in popularity any time soon. Philosophy majors, you are special!
The philosophy major is also increasingly racially or ethnically diverse. The percentage of non-Hispanic White students has been falling steadily since NCES began collecting data in 1995, from 81% then to 58% now. Overall, across all majors, 61% percent of bachelor’s degree recipients are non-Hispanic White, so the philosophy major is actually now slightly less non-Hispanic White than average. (All the race/ethnicity figures below exclude “nonresident aliens” and “race/ethnicity unknown”.)
The National Center for Education Statistics has released their data on bachelor’s degree completions in the U.S. through the 2019-2020 academic year, and it’s mostly good news for the philosophy major.
Back in 2017, I noticed that the number of students completing philosophy degrees in the U.S. had plummeted sharply between 2010 and 2016, from 9297 in 2009-2010 to 7507 in 2015-2016, a decline of 19% in just six years. The other large humanities majors (history, English, and foreign languages and literatures) saw similar declines in the period.

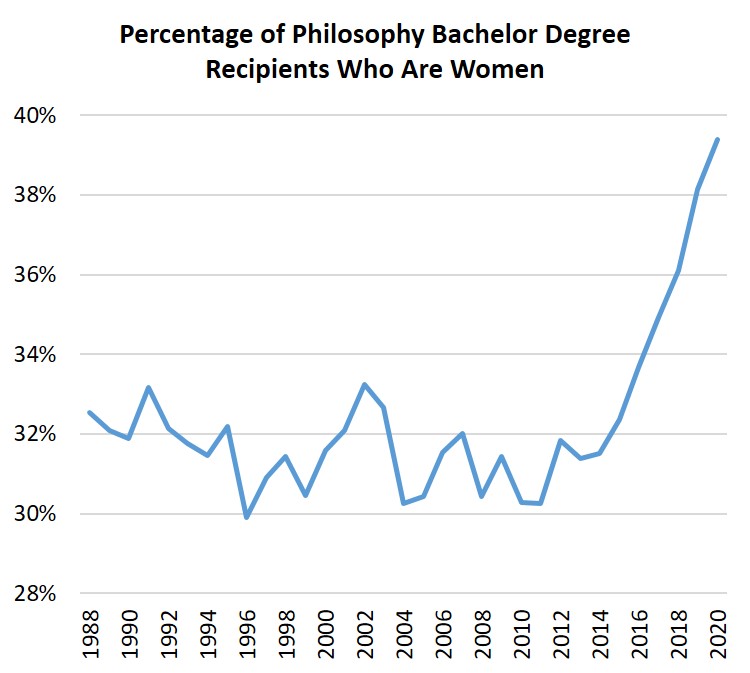
Back in 2017, I also noticed that, going back to the 1980s, the percentage of philosophy majors who were women had remained entirely within the narrow band of 30-34%, despite an increase in women in the undergraduate population overall. However, in the most recent four years, this percentage rose to 39.4%. [ETA 1:48 p.m.: Since 2001, the overall percentage of women among bachelor’s recipients across all majors has stayed fairly constant at around 57%.] That might not seem like a big change, but given the consistency of the earlier numbers, it’s actually quite remarkable to me. Here’s a zoomed-in graph to give you a sense of it:
The number of college students graduating with degrees in philosophy continues to increase, as does the gender and racial diversity of this group.
Trend since 2010, total number of philosophy bachelor’s degrees awarded in the U.S.:
A couple of years ago, the trend had started to modestly reverse itself — and furthermore the philosophy major appeared to be attracting a higher percentage of women and non-White students than previously. The newest data show those trends continuing.
As you can see, numbers are up about 9% since their nadir in 2016, though still well below their peak in 2011. (The numbers are slightly different from those in my earlier post, presumably to small post-hoc adjustments in the IPEDS dataset.)
The following chart displays trends for the other four racial categories used by the NCES. In 2011, “two or more races” was introduced as a category. Also before 2011, the Asian category included “Pacific Islander”.


