In the following guest post*, Professor Lassiter shares what he has learned. (A version of this post first appeared at his site.)

It looks like people are being selective in which jobs they apply for, which of course makes sense. I guess I didn’t imagine how selective people were being. The only job I passed on when I was on the market was one in Kazakhstan, and that was at the request of my spouse. But maybe that’s just my desperation. Also, there might be a selection bias in the responses. I sent out emails to the names listed on job ads whose deadlines for applying had passed by Dec 1. Maybe positions with higher numbers of applicants didn’t complete the survey.
How Many People Are Applying for Philosophy Jobs?
by Charles Lassiter
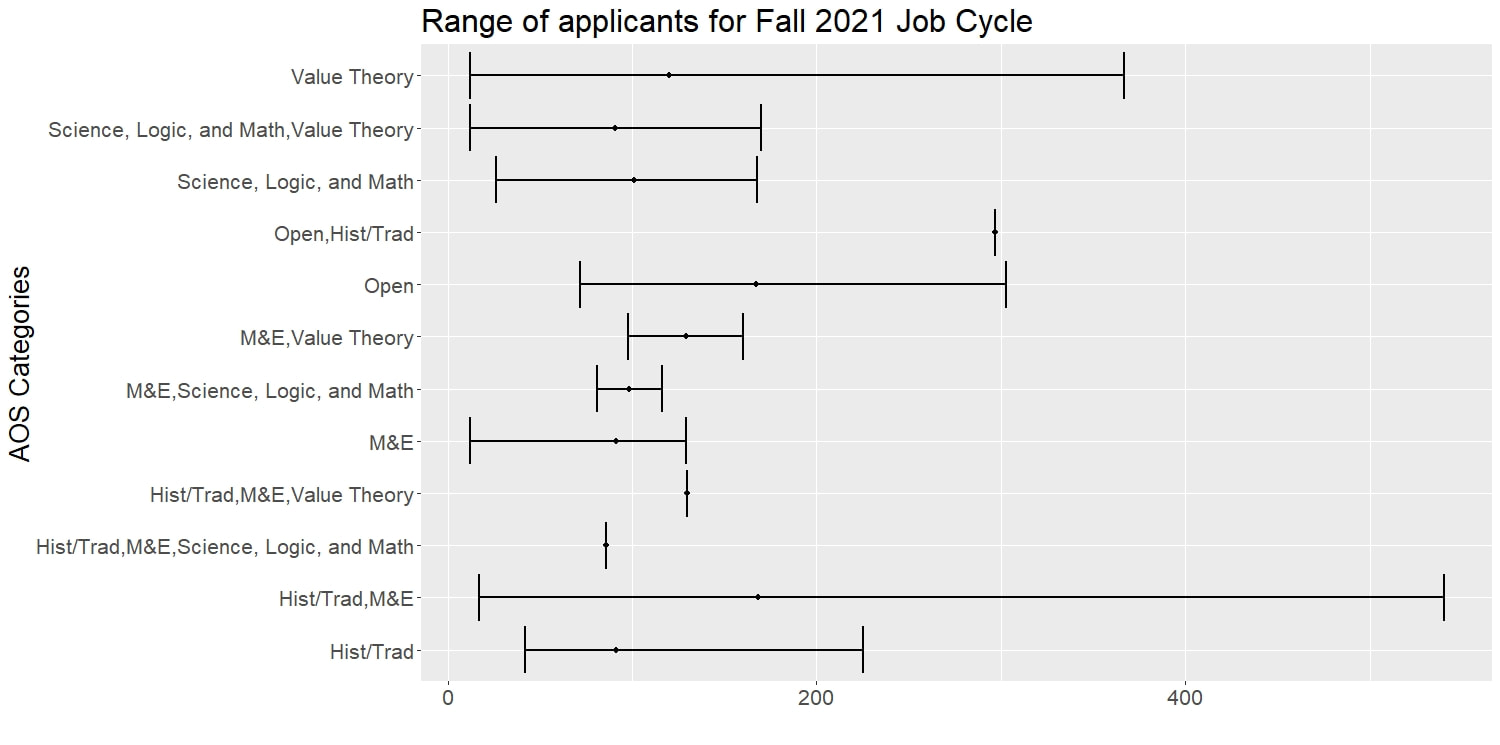
What are the upper and lower bounds? The point is the average for each AOS grouping.
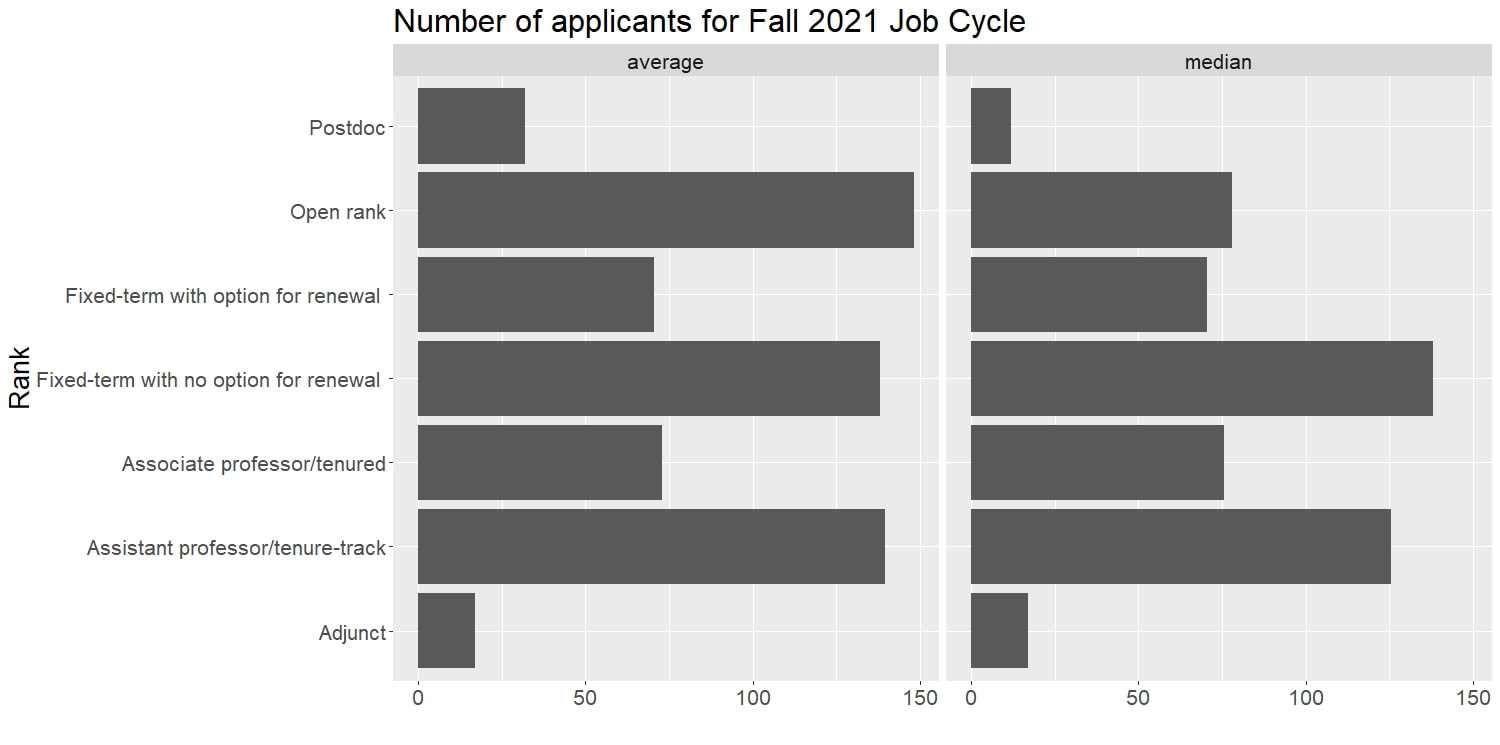
Finally, let’s look at number of applicants by job expectations and rank
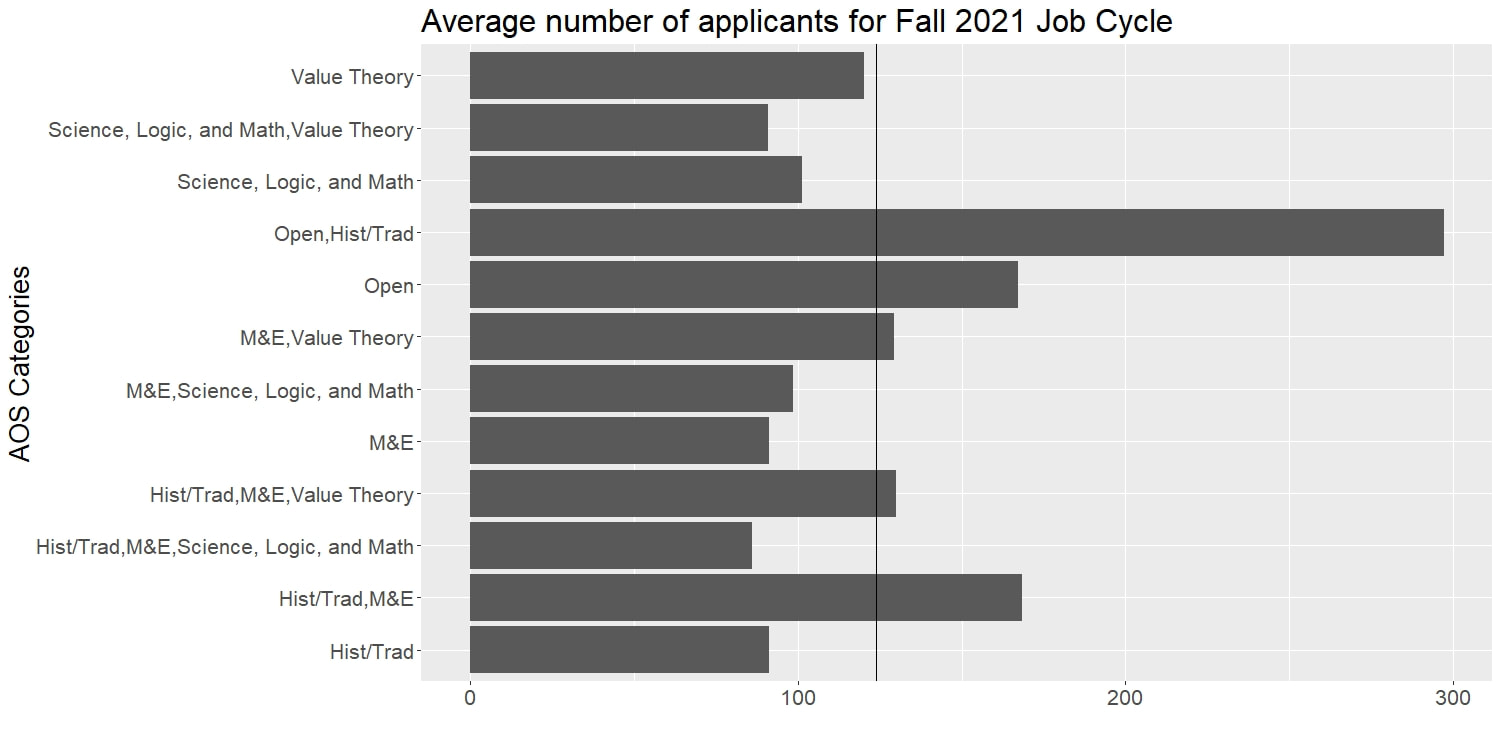
Because respondents were able to choose more than one AOS, we have a variety of overlapping categories. The vertical line is the average number of applicants across all categories, which is 124. (BTW carving the data this way, there wasn’t a big difference between mean and median.)
One of the more challenging questions to figure out is how many people are applying for academic jobs. The NSF’s Survey of Earned Doctorates puts the number of new philosophy PhD’s per year at ~450. But people are on the market multiple times and not everyone who gets a PhD applies for academic jobs. So how many people are applying for jobs? I sent out a survey to heads of search committees to begin figuring it out.
How many people are applying for academic jobs in philosophy? There have been some efforts underway to collect this information, and among them was a survey sent out by Charles Lassiter (Gonzaga) to search committees.
That’s all. If you can think of other analyses you’d like to see, please contact me at [email protected] . Thanks for reading!
[Gerhard Richter, “4096 Colores” (detail)]
I’m interested in hearing from people who passed on applying this year or didn’t apply for some jobs rather than others. If you have a moment, please post (named or pseudonymously) in the comments.

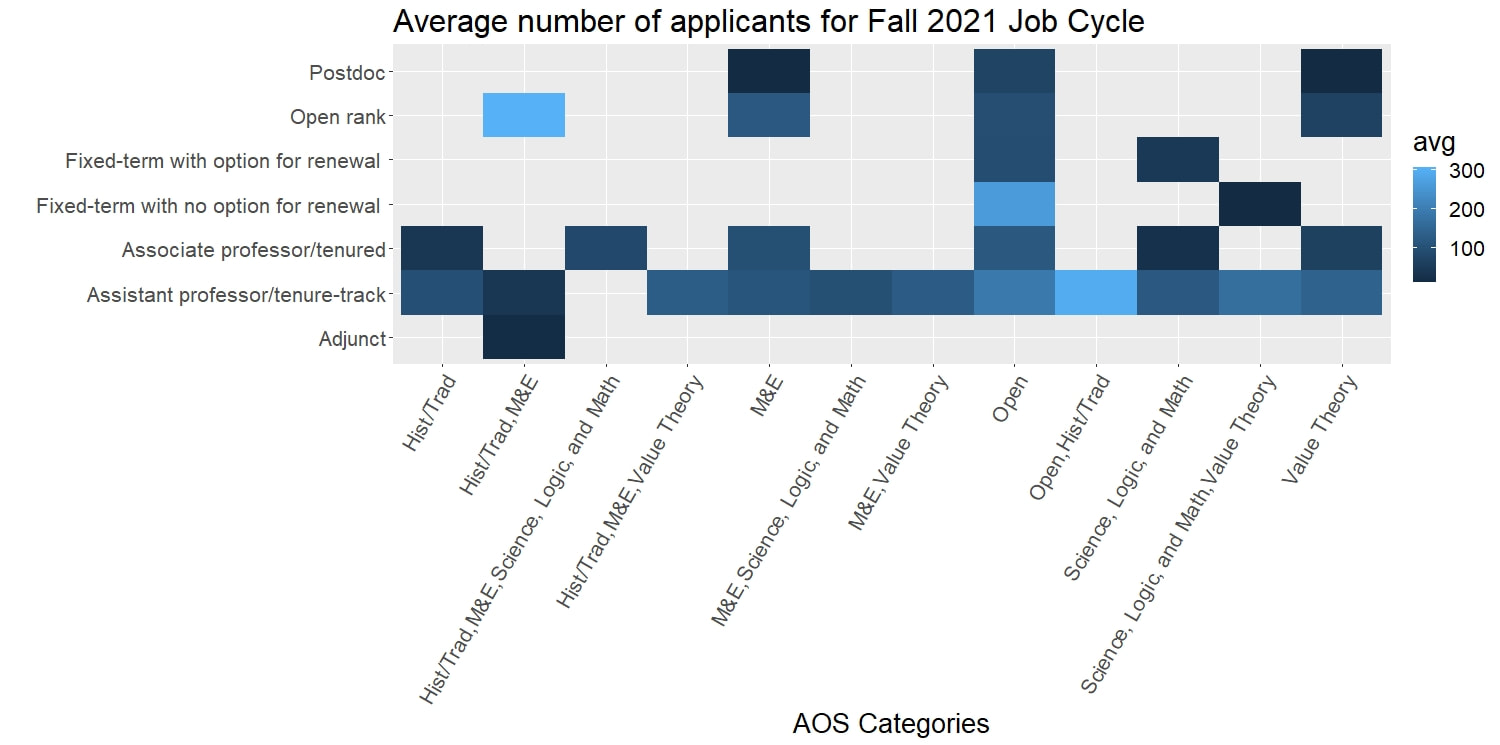
Here’s a heatmap crossing AOS with Rank. The lighter the color, the greater the average number of applicants. No color means that there weren’t any data for that combination (e.g. Postdoc and Hist/Trad).
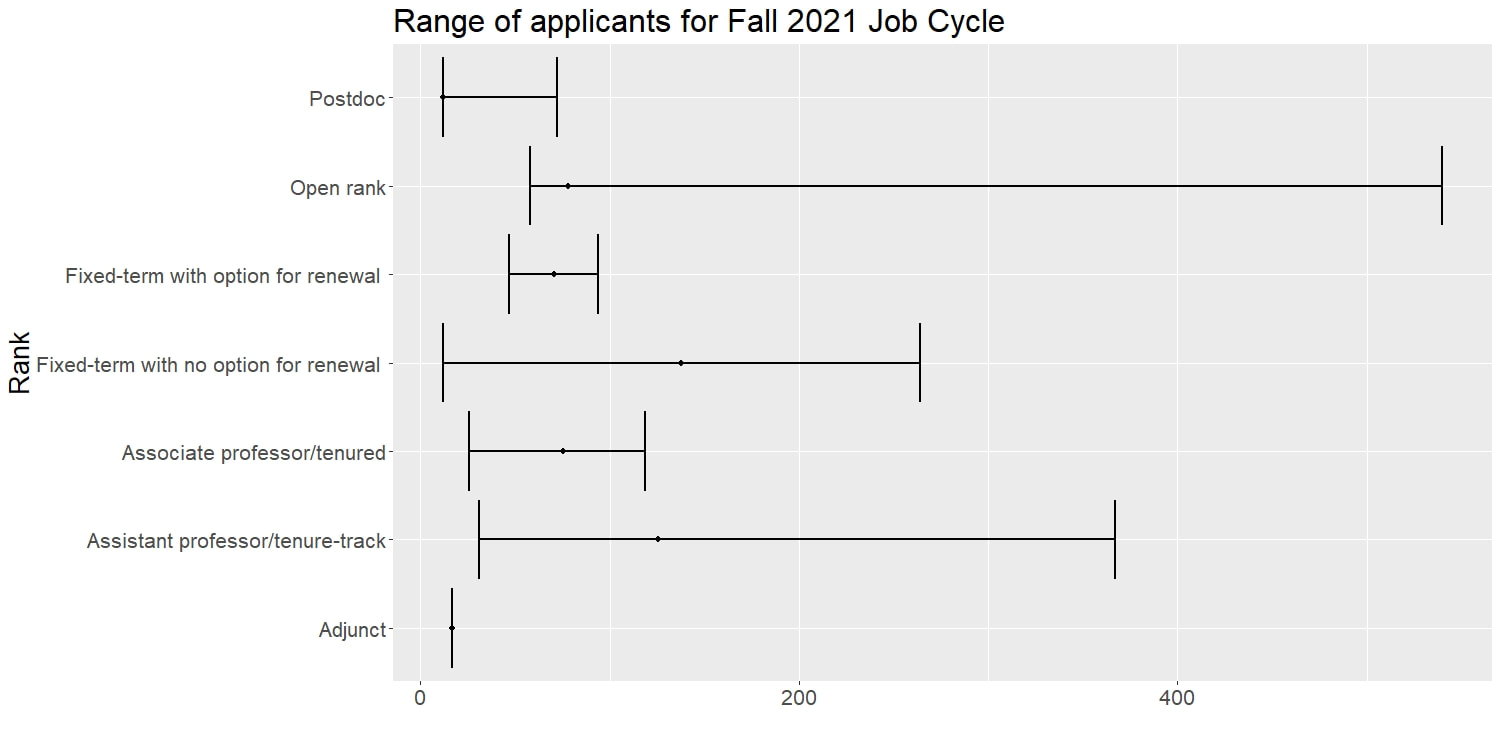
Now let’s look at ranges by rank. The point is the median because outliers had a bigger effect in some categories carving the data this way.
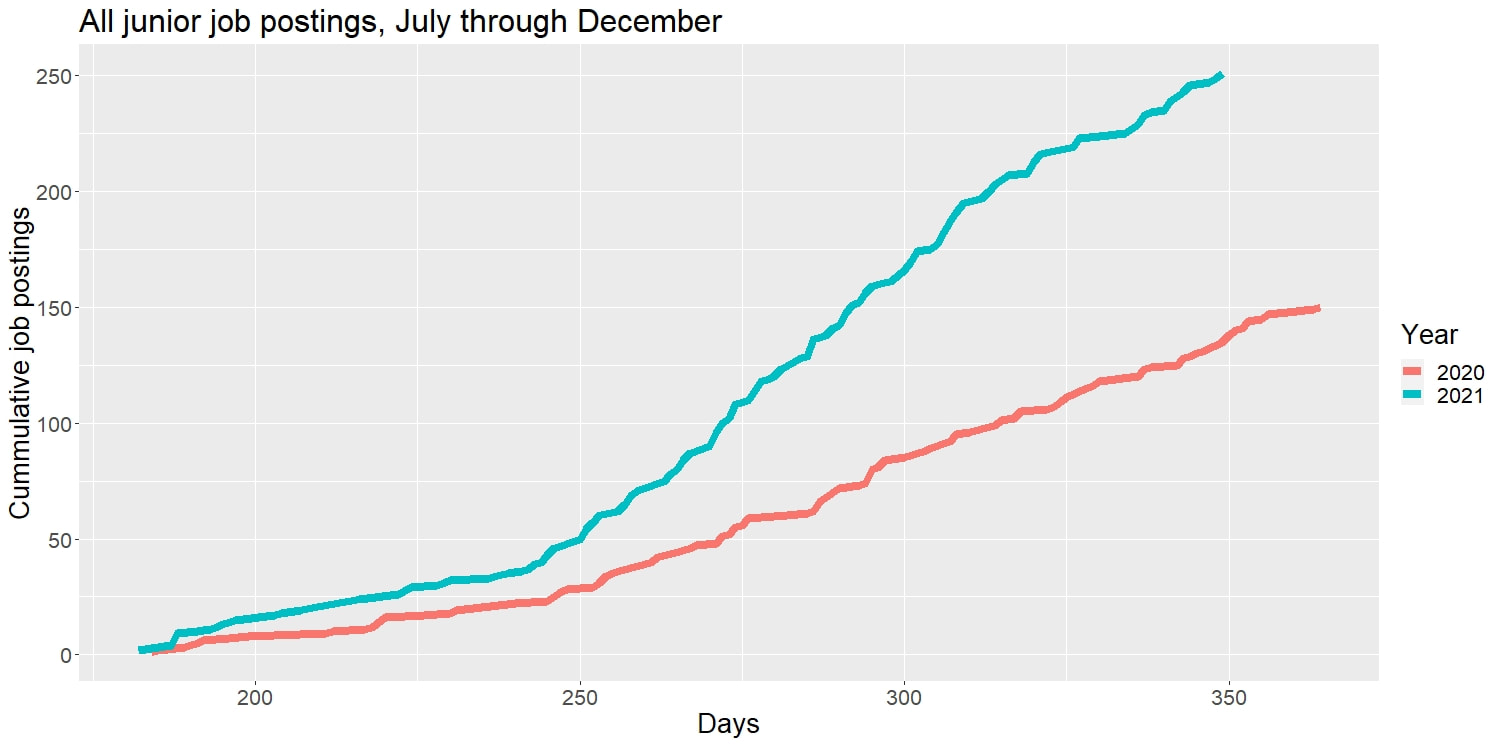
There were nearly 250 junior job ads posted this cycle. (I added 2020 to remind us of how many fewer jobs were advertised last year.) The highest value for an open AOS TT position was 303 and for value theory it was 367. So obviously there are more applicants than there are jobs. The discrepancy here is interesting: there are some folks who applied for value theory TT jobs who didn’t apply for open AOS jobs. So using open AOS as a proxy for number of people on the market comes with some caveats.
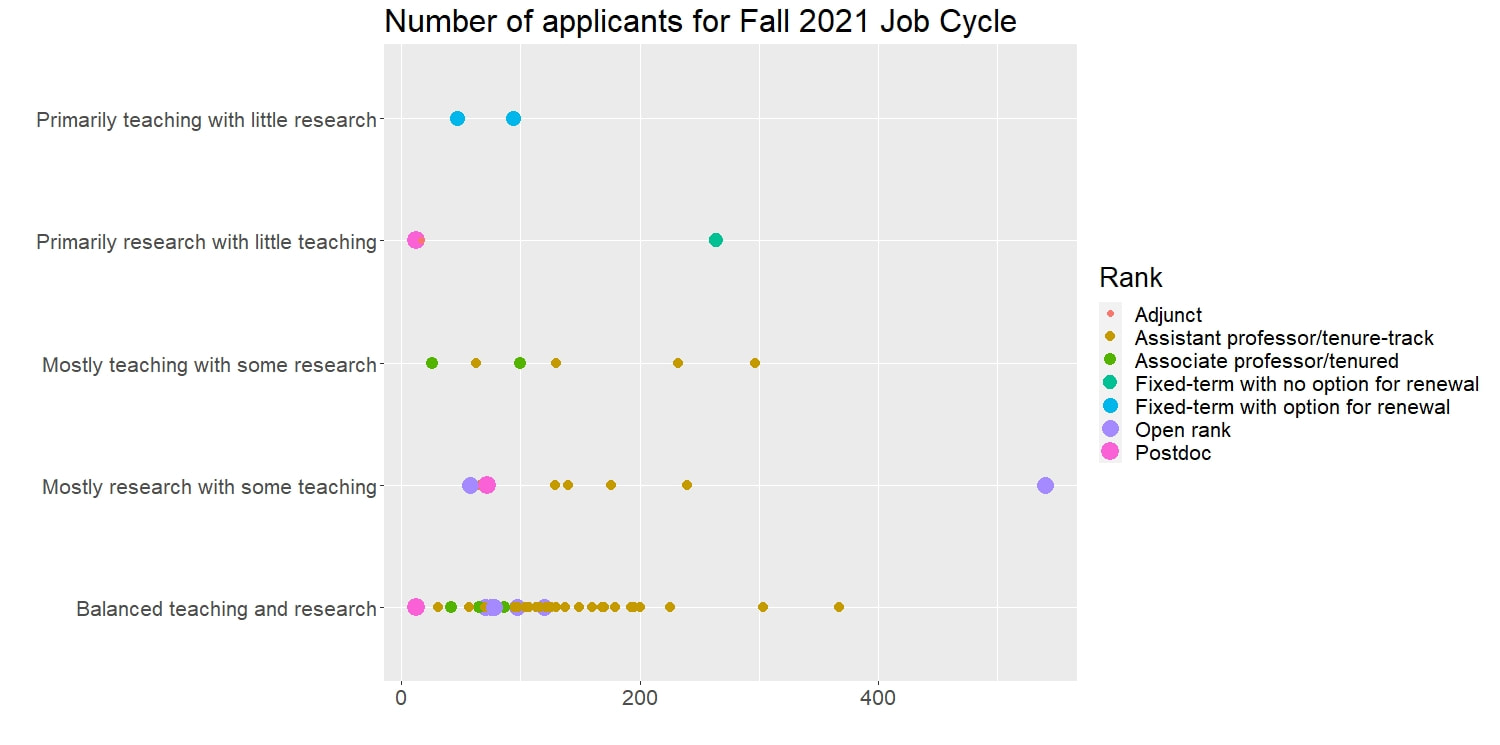
There are the data. What are the takeaways? First, I was expecting upwards of 300 applicants for open AOS, but it’s about 175 (including open combined with other areas). If we filter for open AOS and TT, then the number of applicants goes up to 200. Second, it doesn’t seem like applicants discriminate much between TT and fixed-term jobs: there are about as many applications for TT jobs as fixed-term without renewal jobs. This makes sense: philosophers gotta pay the rent, if only for a year. Finally, it looks like a job with balanced teaching and research demands had more applicants than straight research gigs. This is fascinating. It seems like, contra received wisdom, people aren’t holding out for cushy research gigs. If we’re judging by numbers of applicants, having a mostly research job isn’t the ideal for many young philosophers, contra the received wisdom.
The question to my mind is, why are there so few applicants? Don’t get me wrong—200 on average is a lot of people. But I expected there to be much more given the awful market last year. Consider the following graph of junior job ads:
I sent out around 200 emails and 70 surveys were completed. Thank you to everyone for filling out the survey. I originally was going to hold off until February because there are still some deadlines that haven’t passed, but I’ll update these numbers as more data roll in.
Now let’s do it for rank. Since there were some sizable differences in some categories between the mean and median carving up the data this way, I’ve included both. Compare, for instance, open rank average and median. (This is explained by an outlier of 524 applications!)
The survey was brief: how many applicants, AOS (using PhilJobs’ categories), job expectations, rank, and reaction to number of people who applied. Here’s what I found:
But first: gratitude. Nathan Ballantyne, Julianne Chung, Maria Howard, Greta Turnbull, Joe Vukov, Tim Weidel, and Shane Wilkins provided feedback on the survey and gave suggestions for thinking about the data. Our department’s work study Kate Kellen collected emails from PhilJobs—thank you Kate! She’s graduating this year; so if you have a side gig and you need someone for data entry and similar tasks, drop Kate a line.


