Comparing placement rates across different AOS categories, Value Theory has the highest permanent academic placement rate at 51%. That is, 51% of 2011-2021 graduates with a primary AOS in the category of Value Theory are now in permanent academic positions, excluding those now in non-academic positions. Following Value Theory is History and Traditions at 48%, Language, Epistemology, Metaphysics, and Mind at 43%, and Science, Logic, and Math at 43%.
** This list was edited. Originally, Buffalo’s program had mistakenly been listed among the bottom ten; but it does not belong there. Relatedly, Temple University was added to this list.

In the next month APDA’s board of advisors will be meeting to discuss the transition to a board of directors model for the project. Your feedback on any of the above, including how APDA is run, is welcome and will be considered by both myself and the board.
A Guide to Graduate Programs in Philosophy
Based on Job Placement and Student Experience
by Carolyn Dicey Jennings
What’s more, Value Theory has the highest placement into non-academic jobs: 16%. That is, a higher proportion of 2011-2021 philosophy PhD graduates with a primary AOS in Value Theory are now in non-academic jobs than any other category. This is followed by those in Science, Logic, and Math (15%), Language, Epistemology, Metaphysics, and Mind (13%), and History and Traditions (12%).
The number of professors and resources have decreased since I attended. The hobbling of the Dewey Center is especially troubling. Further, the funding situation for graduate students is abysmal.
In order to see the contrast in public comments from current students and graduates for these two groups, I created a word cloud for all words used by at least 2 participants from the top 10 programs but not also used by any participants from the bottom 10 programs:
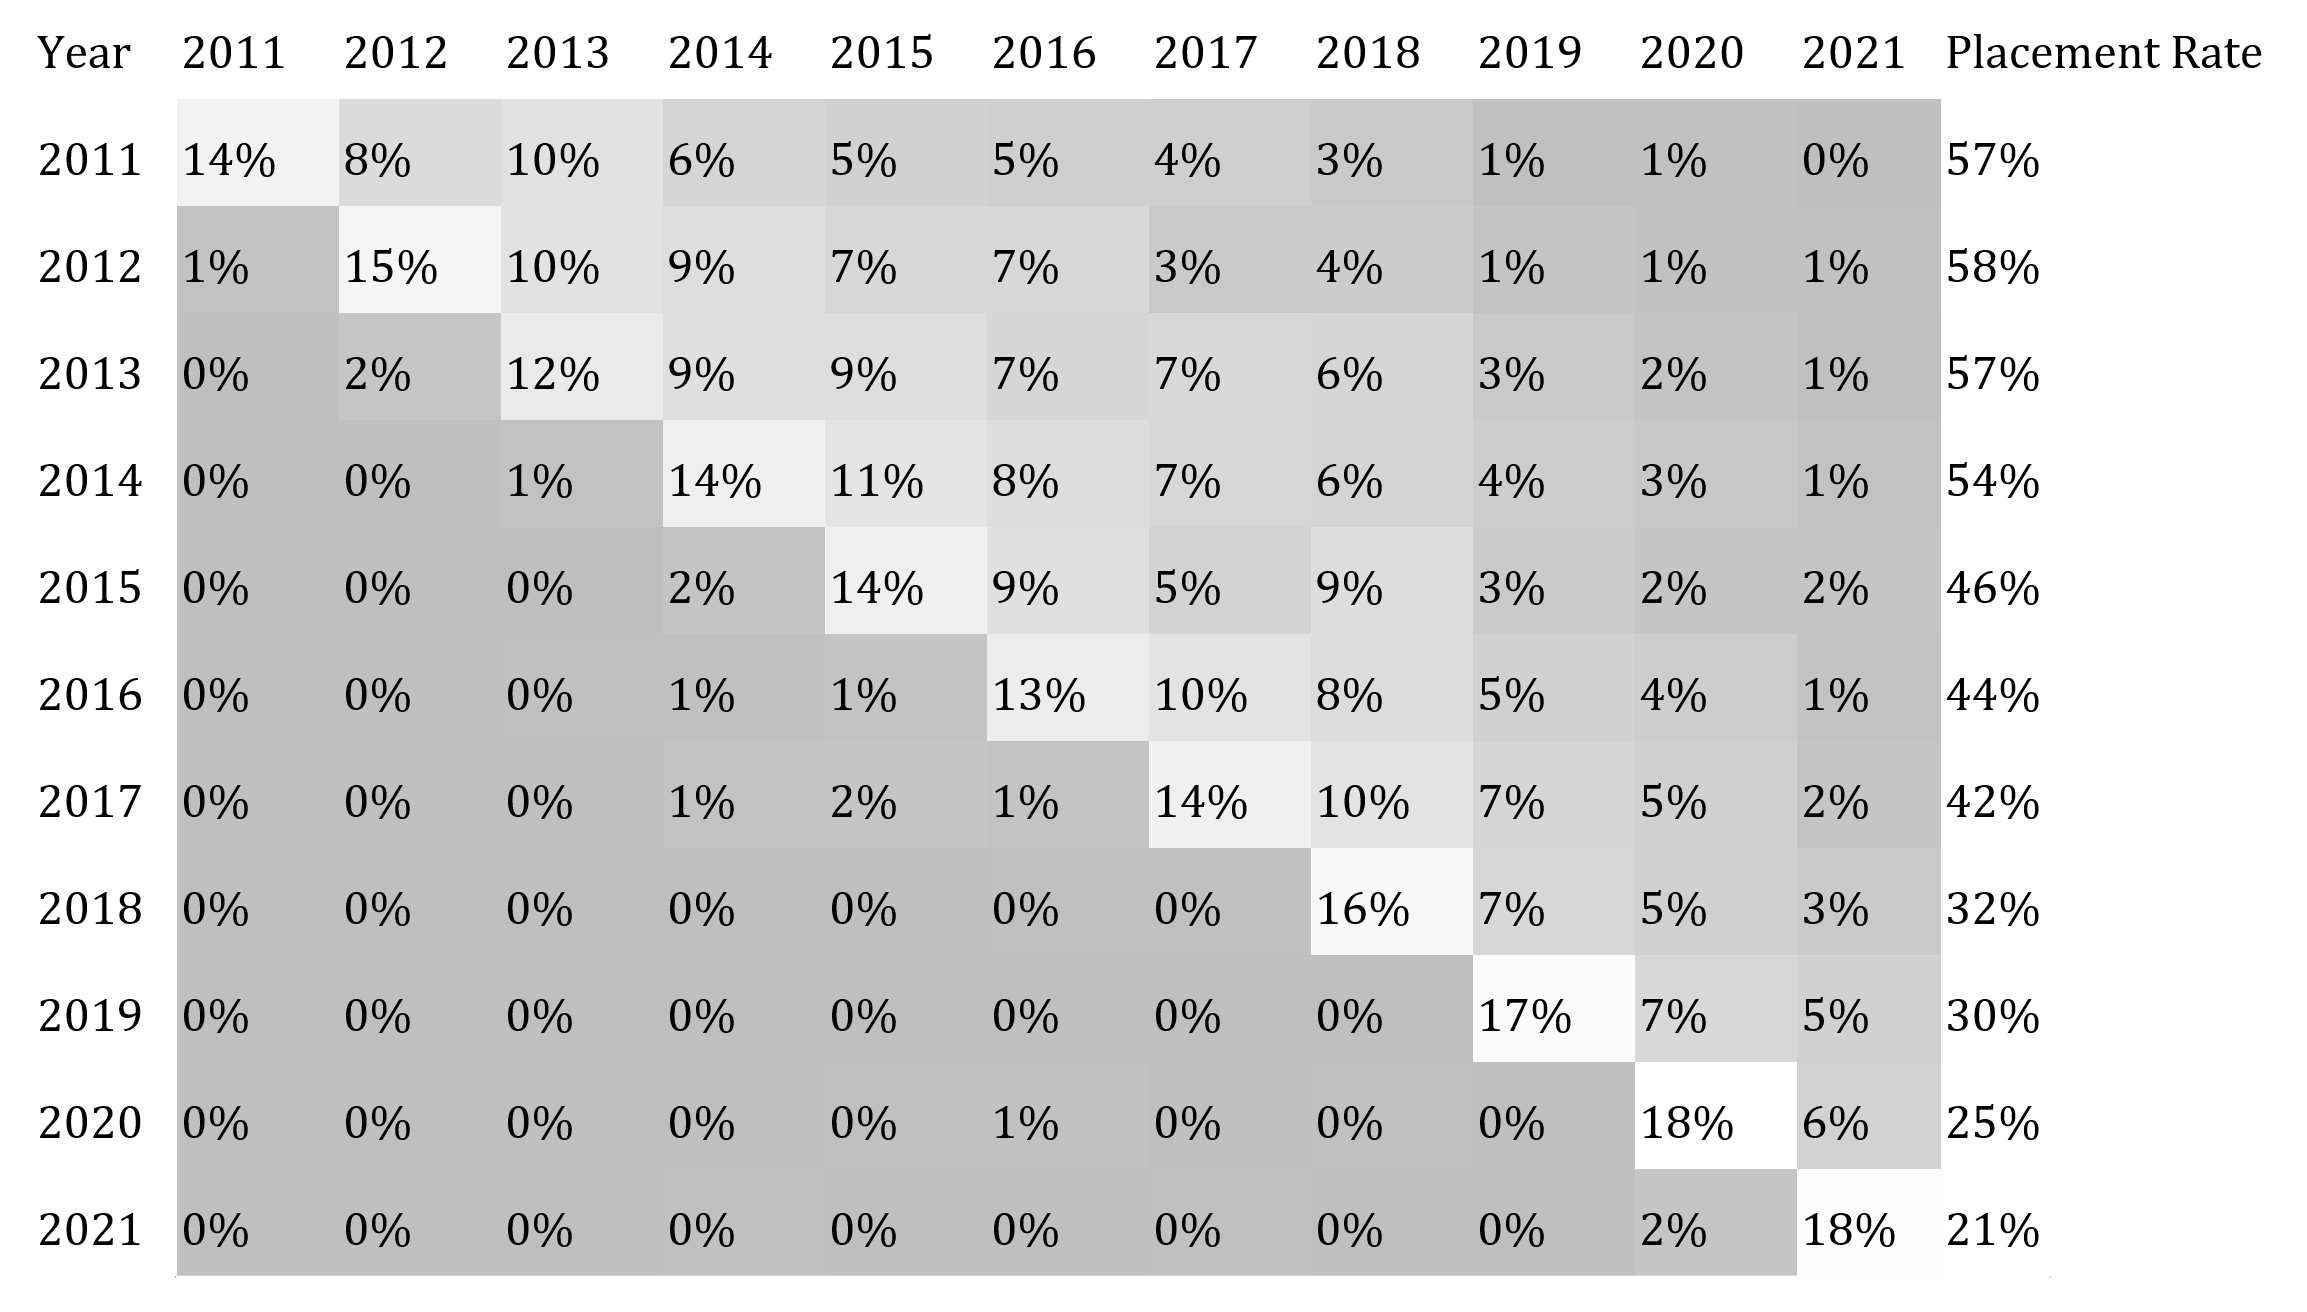
Breaking this down by graduation year, 57% of 2011 PhD graduates are now in permanent academic jobs, whereas only 25% of 2021 graduates are. Of course, 2021 graduates have had far less time to find jobs. In the graph below we charted placement rates according to both graduation year (y-axis) and placement year (x-axis). For example, those 2011 graduates who found a permanent academic job in 2011 are divided by the total number of 2011 graduates minus those who are now in non-academic jobs to yield a placement rate of 14% (top left corner). In contrast, 8% of those who graduated in 2011 found permanent academic placement in 2012. The cells are shaded white if they have higher numbers, and gray if they have lower numbers. It is clear that the highest proportion of graduates each year are placed in their first year out, and that this proportion has not reduced over time. (Yay!)
Given the pandemic and its effects on the job market, one thing you might be wondering is whether students are less likely to recommend their graduate programs now. We did not find this to be the case. Students were “somewhat likely” to recommend their programs in 2018, and the same is true for 2021. Moreover, this average is the same for those participants who graduated prior to 2018, post 2018, and who are now current students.
[Julie Cockburn, “Quizitive” (detail)]
In the meantime, you can take a look at an anonymized version of our data on the landing page of our website, some graphs and tables from past data pulls, blog posts at our website, including a 2020 post on the best PhD programs in philosophy, and links to past research reports, including the 2019 report on diversity and inclusivity.
The top ten programs for climate rating were (in alphabetical order): Australian National University (4.5), London School of Economics and Political Science (4.5), Saint Louis University (4.5), St Andrews and Stirling Graduate Programme in Philosophy (4.6), Stanford University (4.5), The Catholic University of America (4.6), University at Buffalo (4.6) , University of Sheffield (4.6), Uppsala University (5.0), and Rice University (5.0). The bottom ten are (again, in alphabetical order): Katholieke Universiteit Leuven (3.2), McGill University (3.2), McMaster University (3.3), Princeton University (3.3), Southern Illinois University (3.0), University of Chicago (2.8), University of Missouri (3.2), University of Texas at Austin (3.3), Western University (2.6), and York University (3.3).
The top used word in the public comments exclusively used by those from top 10 programs was “encouraging,” whereas the top word used exclusively by those from the bottom 10 programs was “white.”
We intend to analyze the public and non-public comments over the next year to see if we can find trends in these responses.
There was dissent within the department that was not merely philosophical differences, but sometimes a lack of mutual respect. Grad students were discouraged from teaching at the College (diploma) level and were told that teaching experience would not increase the likelihood of an academic career. At least 2 of the faculty union strikes highlighted the rifts between fulltime faculty and part-time faculty & Teaching Assistants. There was also a lack of diversity in the department that hindered the creation of an inclusive community.
And here’s one from a bottom 10 program (in terms of climate rating):
Here is a randomly selected public comment from someone at one of the top ten programs (in terms of overall rating):
And here’s one from someone at one of the bottom ten (in terms of overall rating):
Here’s a randomly selected public comment from someone at a top 10 program (in terms of climate rating):
Socialisation between grad students, postdocs and permanent faculty is heavily encouraged. Grad students are treated as equals and as individuals with academic projects, not just lowly staff. Many social events and para-professional social situations are offered to help everyone fit in. In addition, there are dedicated grad-student-only seminars and conferences to enable students to practice and participate in a lower-stakes environment.
* This sentence was edited; the original number of 127 programs was incorrect.
If we combine student recommendations for the 2021 survey and the previous survey, we have information for 125 programs, each with 5 or more survey participants.* Their average ratings are here, along with the number of participants and keywords selected by participants to describe the program.

Academic Placement Data and Analysis (APDA) is a resource for prospective philosophy graduate students and others to learn about how well particular graduate programs do with getting their graduates jobs, and what it is like to be a student in those programs.
1. The climate is very good. 2. People are always around the department. 3. There are lots of reading groups and workshops etc—lots of opportunities to present your work. 4. Faculty are excellent and most clearly care a lot about graduate education. 5. The graduate students are in general very good. This pushes you to become a better philosopher.
In the following guest post*, the creator of APDA, Carolyn Dicey Jennings, describes some recent and forthcoming updates to it.
According to this metric, the top ten rated programs are (in alphabetical order): Australian National University (4.8), Carnegie Mellon University (4.6), Massachusetts Institute of Technology (4.7), Rutgers University (4.7), Saint Louis University (4.7), University of California Berkeley (4.7), University of California Irvine (LPS; 4.6), University of California Riverside (4.8), University of Southern California (4.6), and Uppsala University (5.0). The bottom ten are (in alphabetical order): DePaul University (3.3), Johns Hopkins University (3.2), Marquette University (3.2), McGill University (3.3), Southern Illinois University (3.2), Temple University (2.4), University of Georgia (2.8), University of Guelph (2.8), University of Illinois at Urbana-Champaign (2.7), and University of Kansas (3.2).**
First, a little background: APDA collects information about those who graduate with a PhD in philosophy and their subsequent job placement using both public sources of information and input from placement directors and the graduates themselves. We work with the oversight of UC Merced’s IRB, and all those with access to the data have research ethics training. Our database has information on approximately 14,000 PhD graduates and current students, primarily for the years 2011-2021. In late July we sent out a survey to around 10,000 of those students and graduates (all those for whom we had an email address on file) and around 1,000 participants took part. Our findings are a result of data gathering efforts over the summer as well as these survey responses.
We are nearing the 10-year anniversary of the start of the APDA project: Academic Placement Data and Analysis began as an Excel spreadsheet in December 2011, when I was trying to figure out placement trends my first time on the job market. I had heard all kinds of anecdotes and stories, but I wanted facts. What proportion of candidates get permanent academic jobs? What kinds of people are more likely to get these jobs? I have worked with numerous other people over the years to find answers to these and connected questions about academic philosophy. I am currently finishing up a report on this year’s findings with a graduate student, Alex Dayer, under the advice of our board of advisors. We plan to send that report out for publication in the next month, with some more blog posts along the way. In this post I provide some of the findings on job placement and student ratings.
Finally, a brief report on academic job placement. We looked at 6641 graduates between 2011 and 2021, 2606 of whom are now in permanent academic jobs, and 901 of whom are now in non-academic jobs. Thus, excluding those in non-academic jobs, 45% of the graduates from this time period are in permanent academic jobs. The remaining graduates are either in temporary academic jobs or have no employment on record. Narrowing this down to just those 131 programs for which we were able to collect and check data in 2021 (excluding those with no accessible placement page or dissertation records), the numbers are slightly improved, with 47% now in permanent academic positions. (We will release program-specific placement rates with the published report.)
Given that the majority of graduates are not placed into permanent academic positions, we decided to look more closely at those in non-academic careers for this year’s survey. Marcus Arvan (Tampa) will be writing a blog post soon on this topic at The Philosophers’ Cocoon, and more details will be available in the final report when it is published. In addition, Eric Schwitzgebel (UC Riverside) will be writing a post on some of our findings at The Splintered Mind with respect to demographic representation in philosophy. These findings, including results from our first question on political orientation, will also be available in the final report.
You might have noticed that the programs that receive high recommendations are noted for their community and support. I have been wondering what leads to this sense of community, and so this year we decided to ask participants about their satisfaction with their program’s efforts to foster a healthy, respectful academic culture or climate. Coding these responses from 1 for very unsatisfied to 5 for very satisfied, the mean response is 3.8 out of 5.

